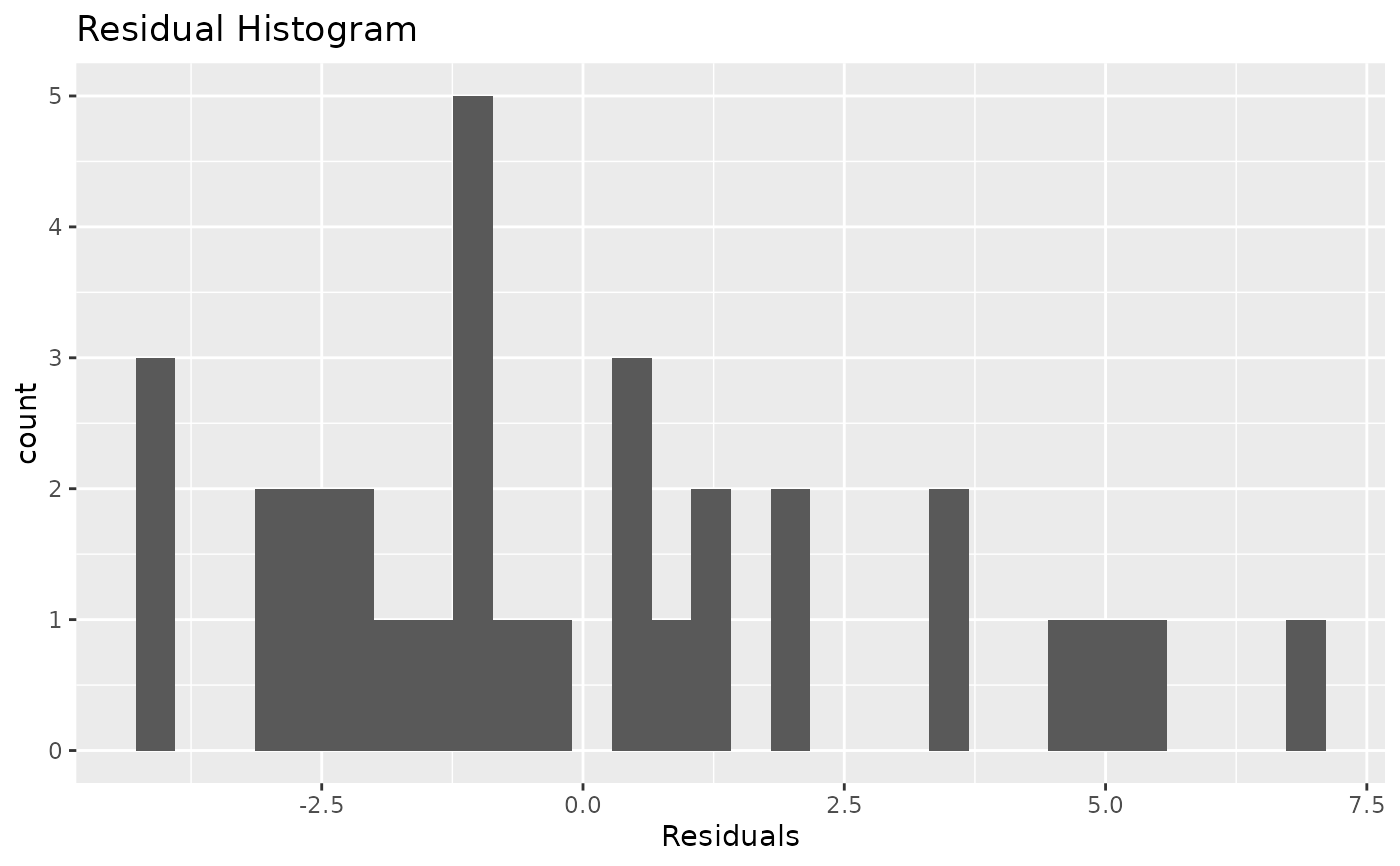
Visualize the distribution of the residuals of a model.
Usage
stat_resid_hist(bins = 30, ...)
Arguments
- bins
Adjust the number of bins.
- ...
Currently ignored. For extendability.
Value
A `ggplot2` layer for plotting a histogram of residuals.
Examples
data(mtcars)
model <- lm(mpg ~ cyl + disp + hp, data = mtcars)
ggplot2::ggplot(data = model) + stat_resid_hist()