Usage
stat_normal_qq(alpha = 0.5, ...)
Arguments
- alpha
Adjust transparency of points.
- ...
Currently ignored. For extendability.
Value
A `ggplot2` layer for plotting a Normal Q-Q plot.
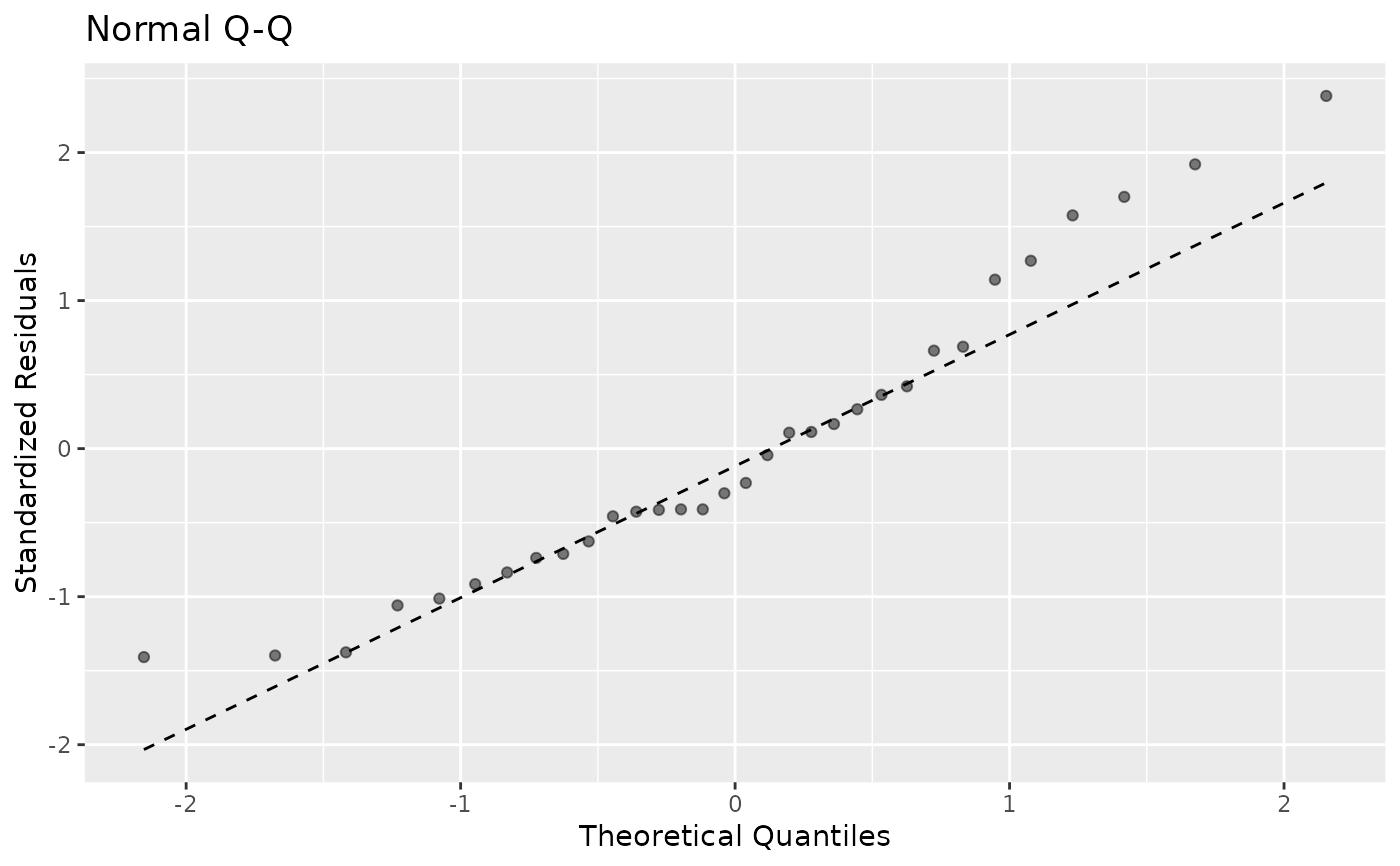
Examples
data(mtcars)
model <- lm(mpg ~ cyl + disp + hp, data = mtcars)
ggplot2::ggplot(data = model) + stat_normal_qq()