Cook's Distance vs. Leverage
Examples
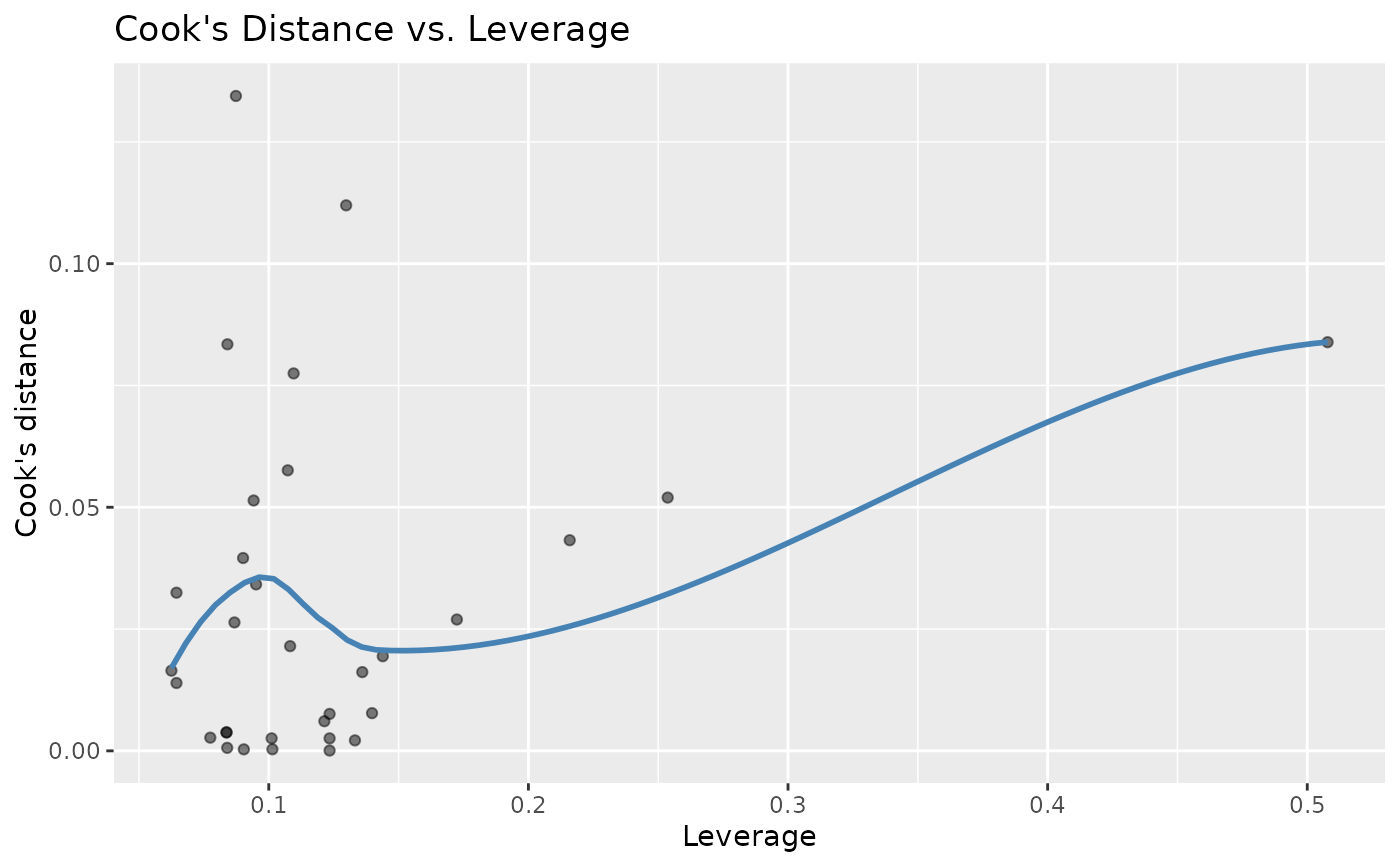
data(mtcars)
model <- lm(mpg ~ cyl + disp + hp, data = mtcars)
ggplot2::ggplot(data = model) + stat_cooks_leverage()
#> Warning: Using `size` aesthetic for lines was deprecated in ggplot2 3.4.0.
#> ℹ Please use `linewidth` instead.
#> ℹ The deprecated feature was likely used in the gglm package.
#>   Please report the issue at <https://github.com/graysonwhite/gglm/issues>.