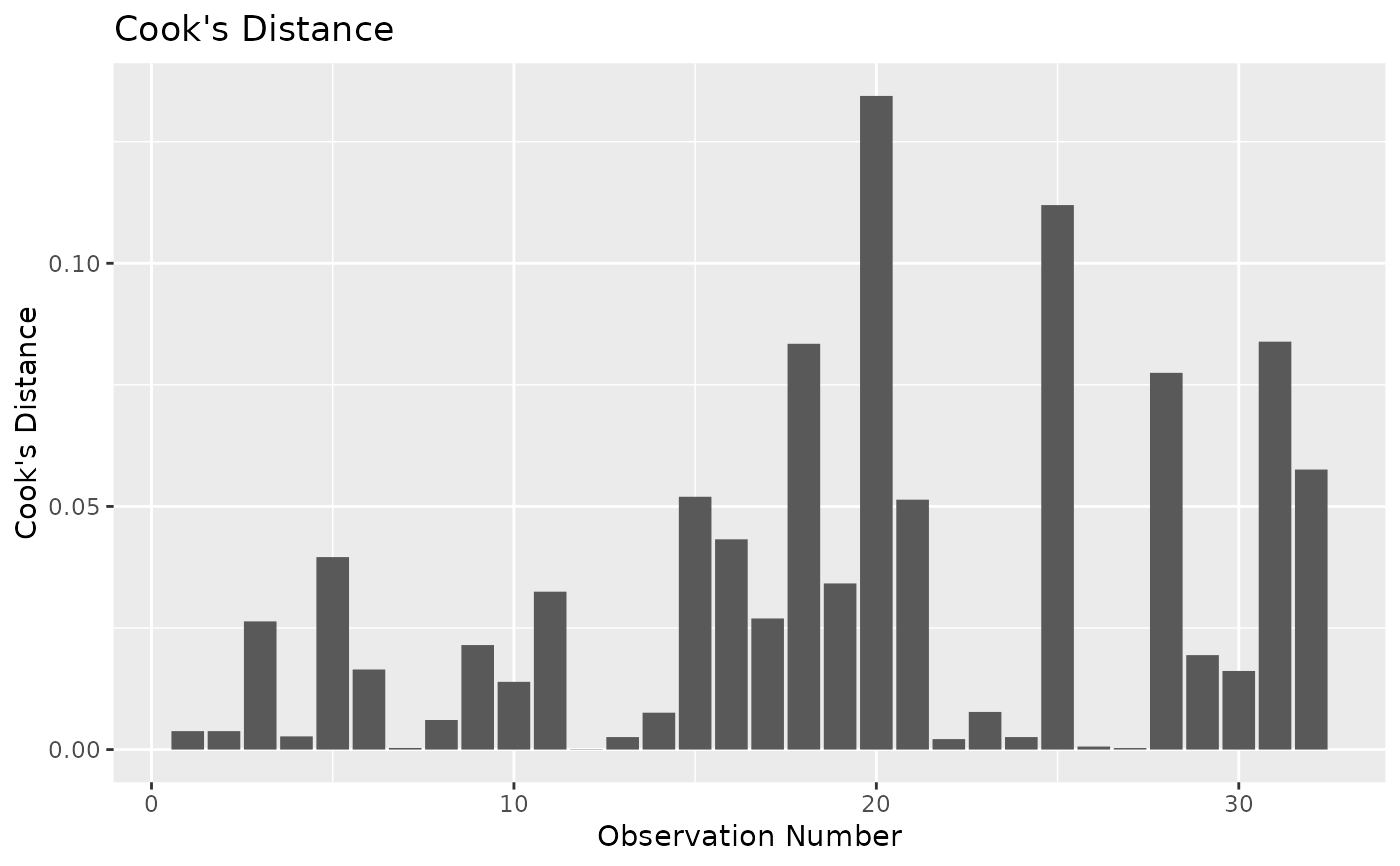
`ggplot2` layer for plotting cook's distance by observation number.
Usage
stat_cooks_obs(mapping = ggplot2::aes(), ...)
Arguments
- mapping
Additional aesthetic mappings to add to the layer, e.g.
`aes(fill = some_var)`.
If `mapping` includes a required aesthetic (e.g. `x`, `y`), the supplied
value is ignored in favor of the default and a warning is issued.
- ...
Additional arguments passed on to `geom_col()`.
Value
A `ggplot2` layer for plotting cook's distance by observation number.
Examples
data(mtcars)
model <- lm(mpg ~ cyl + disp + hp, data = mtcars)
ggplot2::ggplot(data = model) + stat_cooks_obs()